Step plot statement inside the SGPLOT procedure:
STEP X=variable Y=variable / GROUP=variable;

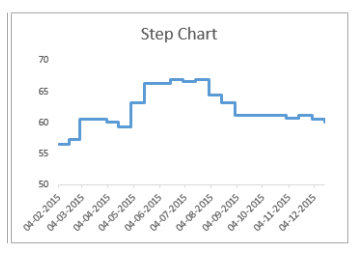
A line chart would connect a the data points in such a way that we see a
trend. The focus in such charts is the trend and not the exact time of
change. But, a step chart shows the exact time of change in the data
along with the trend. We can easily spot the time period where there was
no change, and can compare the magnitude of change at each instance
No comments:
Post a Comment